Overview
Even as public views of the federal government in Washington have fallen to another new low, the public continues to see their state and local governments in a favorable light. Overall,
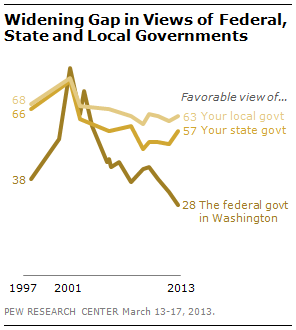
63% say they have a favorable opinion of their local government, virtually unchanged over recent years. And 57% express a favorable view of their state government – a five-point uptick from last year. By contrast, just 28% rate the federal government in Washington favorably. That is down five points from a year ago and the lowest percentage ever in a Pew Research Center survey.
The percentage of Democrats expressing a favorable opinion of the federal government has declined 10 points in the past year, from 51% to 41%. For the first time since Barack Obama became president, more Democrats say they have an unfavorable view of the federal government in Washington than a favorable view (51% unfavorable vs. 41% favorable). Favorable opinions of the federal government among Republicans, already quite low in 2012 (20% favorable), have fallen even further, to 13% currently.
The national survey by the Pew Research Center, conducted March 13-17 among 1,501 adults, finds positive ratings across party lines for state and local governments overall. But the partisan makeup of the state government matters: Republicans give more positive ratings to GOP-led state governments, while Democrats rate Democratic-led state governments more highly.
Notably, politically divided state governments get positive ratings from members of both parties. In the 13 states with divided governments – those in which the governor and a majority of state legislators are from different parties – majorities of both Republicans and Democrats express favorable opinions of their state governments.
A sizable majority of Americans (69%) say that their state is currently facing budget problems. However, assessments of state budgets were even more negative two years ago; in February 2011, 81% said their state was encountering budget problems. And while just 30% say that economic conditions in their state are excellent or good, that is nearly double the percentage expressing a positive view of the national economy (16% excellent or good).
Partisan Views of Government
Currently, 41% of Democrats say they have a favorable opinion of the federal government, compared with 27% of independents and just 13% of Republicans. By contrast, state and local
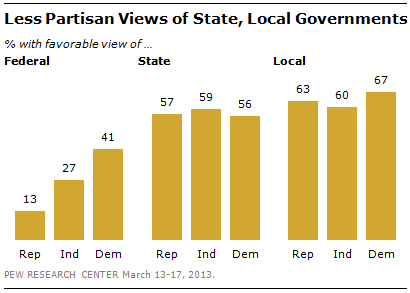
governments are viewed favorably across-the-board.
Nearly identical percentages of Democrats (56%), Republicans (57%) and independents (59%) have a favorable opinion of their state’s government. Similarly, local governments receive positive ratings from 67% of Democrats, 63% of Republicans and 60% of independents.
While there is partisan agreement in overall ratings of state governments, these opinions differ markedly depending on which party controls the government.
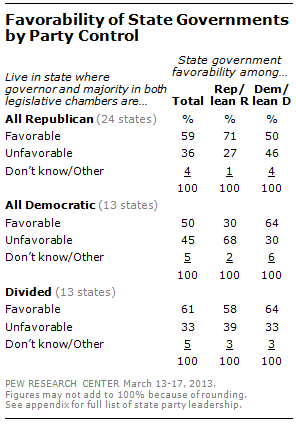
Fully 71% of Republicans and Republican-leaning independents who live in Republican-led states (those with a GOP governor and state legislature) have a favorable opinion of their state government. But just 30% of Republicans living in Democratic-led states view their state governments favorably.
Democrats and Democratic leaners in Democratic-led states express positive views of their state governments (64% favorable). But unlike Republicans, Democrats do not have unfavorable opinions of state governments led by the opposing party. Among Democrats living in Republican-led states, as many have a favorable (50%) as unfavorable (46%) opinion of their state government.
Politically divided state governments receive about the same ratings from Democrats and Democratic leaners (64% favorable) as from Republicans and Republican leaners (58% favorable).
Views of State Governors

Overall, state governors received a positive rating from the public: 55% rate their state’s governor favorably, compared with 30% who hold an unfavorable view. Views of state governors in states with a Republican officeholder (55% favorable) are nearly identical to views in states with Democratic governors (56%).
Unlike views of state governments, neither Republicans nor Democrats offer highly negative ratings of their governor, even in cases where the opposing party holds office.
Overall, 43% of Republicans and Republican leaners in states with a Democratic governor rate their state governor favorably, while 48% have an unfavorable view. Opinions among Democrats and leaners in states with an opposing party governor also are mixed: 43% of Democrats in states with a Republican governor express a favorable view of their state governor, 44% an unfavorable one.
Both Republicans and Democrats offer a highly favorable view of their governor in states where their own party is in control (73% of Republicans and Republican leaners, 68% of Democrats and Democratic leaners).
Modest Improvement in Views of State Budgets

Nearly seven-in-ten Americans (69%) say their state is experiencing budget problems, down from 81% two years ago. The percentage saying their state does not face budget problems has nearly doubled, from 12% to 21%, during this period.
The percentage saying their state’s budget problems are very serious also has dipped, from 36% in February 2011 to 31% currently.
State economic ratings also have shown modest improvement. Three-in-ten (30%) say economic conditions in their state are excellent (3%) or good (27%), up from 23% two years ago.
Ratings of state economic conditions are more positive than national economic ratings. Just 16% describe national economic conditions

as excellent or good; this compares with 30% who describe the economy of the state they live in as excellent or good in the current survey.
Respondents in states with a Republican governor offer slightly better economic ratings than those living in states with a Democratic governor. About a third (34%) of those in states with a GOP governor describe economic conditions as excellent or good, compared with 24% of those in states with Democratic governors. Similarly, fewer in Republican-governed states say their state is currently experiencing budget problems (66%) than those in Democratic-governed states (73%).
Federal Government’s Declining Favorability

Favorable ratings for the federal government rose dramatically after the Sept. 11, 2001, terrorist attacks, but have declined substantially since then. In November 2001, 82% had a favorable opinion of the government and in December 2002, 73% viewed the federal government favorably.
Positive opinions of the government declined through the remainder of George W. Bush’s presidency and have continued to fall during the Obama administration. Currently, 28% have a favorable impression of the federal government while 65% have an unfavorable view.
Partisan views of the federal government have shifted depending on which party controls the White House. Currently, Democrats have a more favorable impression of the federal government than do Republicans; during the Bush administration, Republicans expressed more favorable opinions.
However, there has been a steep decline in the share of Democrats expressing a favorable opinion of the federal government since Obama took office, from 61% in July 2009 to 41% currently. Favorable opinions also have fallen among Republicans over this period, from 24% to 13% — the lowest ever favorable rating among members of either party.
Appendix: Party of Governors and State Legislatures
States with Republican governors:
AL, AK, AZ, FL, GA, ID, IN, IA, KS, LA, ME, MI, MS, NE, NV, NJ, NM, NC, ND, OH, OK, PA, SC, SD, TN, TX, UT, VA, WI, WY
States with Democratic governors: AR, CA, CO, CT, DE, HI, IL, KY, MD, MA, MN, MO, MT, NH, NY, OR, VT, WA, WV
Republican governors and Republican majorities in both state House and Senate: AL, AK, AZ, FL, GA, ID, IN, KS, LA, MI, MS, NC, ND, OH, OK, PA, SC, SD, TN, TX, UT, VA, WI, WY
Democratic governors and Democratic majorities in both state House and Senate: CA, CO, CT, DE, HI, IL, MD, MA, MN, OR, VT, WA, WV
Mixed party control of governorship, state House and state Senate: AR, IA, KY, ME, MO, MT, NE, NV, NH, NJ, NM, NY, RI
Sources: National Conference of State Legislatures, National Governors Association.

