On June 26, 2015, the U.S. Supreme Court issued a landmark ruling that granted same-sex couples a constitutional right to marry. The 5-4 decision in Obergefell v. Hodges legalized gay marriage nationwide, including in the 14 states that did not previously allow gays and lesbians to wed. The decision rested in part on the court’s interpretation of the 14th Amendment; the justices ruled that limiting marriage to heterosexual couples violates the amendment’s guarantee of equal protection under the law.
As we approach the fourth anniversary of the ruling, here are five key facts about same-sex marriage:
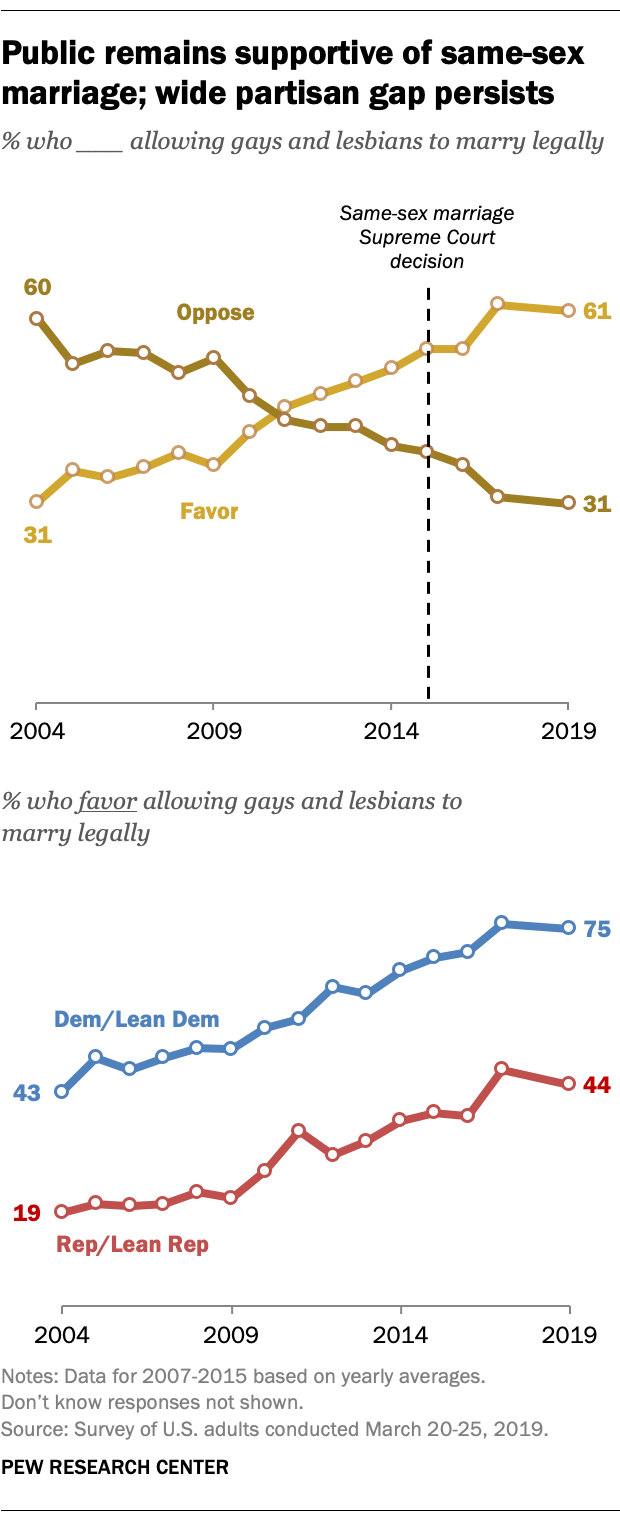
The share of Americans who favor same sex-marriage grew steadily for most of the last decade, but public support has leveled off in the last few years. Around four-in-ten U.S. adults (37%) favored allowing gays and lesbians to wed in 2009, a share that rose to 62% in 2017. But views are largely unchanged over the last few years. About six-in-ten Americans (61%) support same-sex marriage in the most recent Pew Research Center survey on the issue, conducted in March 2019.
Although support in the U.S. for same-sex marriage has increased among nearly all demographic groups, there are still sizable demographic and partisan divides. For example, today, 79% of Americans who are religiously unaffiliated favor same-sex marriage, as do 66% of white mainline Protestants and 61% of Catholics. Among white evangelical Protestants, however, only 29% favor same-sex marriage. Still, this is roughly double the level (15%) in 2009.
While support for same-sex marriage has grown steadily across generational cohorts in the last 15 years, there are still sizable age gaps. For instance, 45% of adults in the Silent Generation (those born between 1928 and 1945) favor allowing gays and lesbians to wed, compared with 74% of Millennials (born between 1981 and 1996). There also is a sizable political divide: Republicans and Republican-leaning independents are much less likely to favor same sex marriage than Democrats and Democratic leaners (44% vs. 75%).
Same-sex marriages are on the rise. Surveys conducted by Gallup in 2017 find that about one-in-ten LGBT Americans (10.2%) are married to a same-sex partner, up from the months before the high court decision (7.9%). As a result, a majority (61%) of same-sex cohabiting couples were married as of 2017, up from 38% before the ruling.
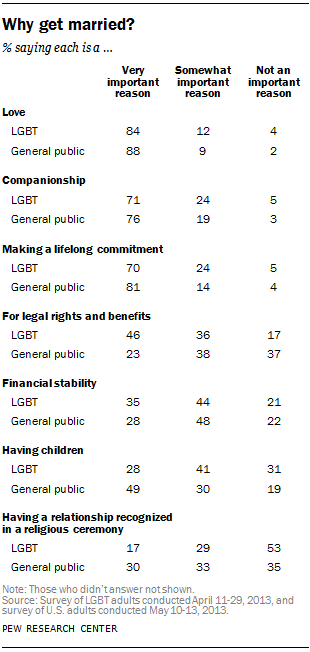
As with the general public, Americans who identify as lesbian, gay, bisexual or transgender (LGBT) are most likely to cite love as a very important reason for getting married. In a 2013 Pew Research Center survey, 84% of LGBT adults and 88% of the general public cited love as a very important reason for getting married, and at least seven-in-ten in both groups cited companionship (71% and 76%, respectively). But there were some differences, too. LGBT Americans, for instance, were twice as likely as those in the general public to cite legal rights and benefits as a very important reason for getting married (46% versus 23%), while those in the general public were nearly twice as likely as LGBT Americans to cite having children (49% versus 28%).
The U.S. is among 29 countries and jurisdictions that allow gay and lesbian couples to wed. The first nation to legalize gay marriage was the Netherlands, which did so in 2000. Since then, several other European countries – including England and Wales, France, Ireland, all of Scandinavia, Spain and, most recently, Austria, Germany and Malta – have legalized gay marriage. Outside of Europe, same-sex marriage is now legal in Argentina, Australia, Brazil, Canada, Colombia, Ecuador, New Zealand, South Africa and Uruguay, as well as in parts of Mexico. And in May 2019, Taiwan became the first country in Asia to allow gays and lesbians to legally wed.
Note: This is an update to a post originally published April 27, 2015. It was originally co-authored by Seth Motel, a former research analyst at Pew Research Center.
Related posts:


